S&P 500
New Policies, Old Outcome

At long last, we’ve exited an investment world that was defined for more than a decade by zero interest rates and Quantitative Easing. Or so we thought.
S&P 500 Earnings Waterfall 2Q 2023
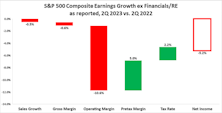
This month’s Refresh continues our practice of summarizing the latest earnings season by evaluating the composite results of the S&P 500 member companies. Many analysts address sales and net income, but rarely speak to the middle lines of the income statement.
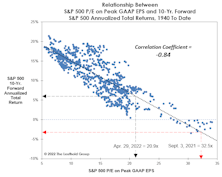
A Rear-View Peek At The Future
Question: Some tactical managers provide long-term forecasts for stock market total returns (7-10 years or longer). Do you publish such estimates?
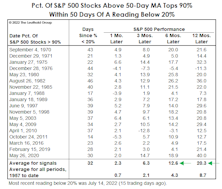
A Look At Where Rate Hikes Are “Working”

Speculative spirits are back, and the index that’s suddenly close to its 2021 high is the one we viewed as the epicenter of the mania—the NY FANG+® Index!
The Pre-Election “Put”

Years preceding presidential elections are more likely than others to feature stock-price action that is favorably disconnected from the fundamentals. Since 1926, the average S&P 500 gain in a pre-election year is +14.2%—about double the next-best year of the cycle.
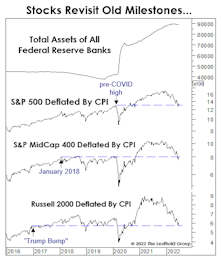
Watching The Wealth Effect
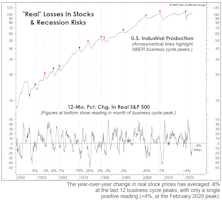
“Real” stock-market wealth has declined considerably since late 2021 without yet delivering a knockout blow. But if the other key evidence detailed throughout this section is on the mark, that wallop is lurking in the very near future.
Just A Typical Pre-Recessionary Rally?
Is the stock market disconnected from a souring economy? It might seem that way, and the topic dominated the discussion at the recent Market Technicians Association annual symposium.
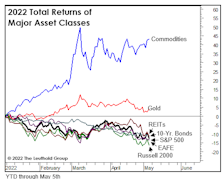
Stocks Versus “Safe Havens”
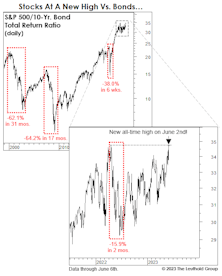
While we aren’t clamoring to add long-term Treasuries in tactical accounts, we believe that the past 18-months’ action has left them more attractive versus stocks than during most of the last 15 years. However, compared to gold, the S&P 500 still trails on a total return basis measured back to Y2K.
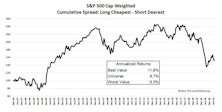
Small Caps Getting Cheaper By The Day
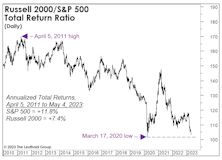
It was September 2020 when we suggested that a new multi-year phase of Small-Cap-stock leadership had begun. Almost immediately, the Russell 2000 reversed a big chunk of the prior decade’s underperformance. Unfortunately, that was the extent of the run.
Small Caps: We’ve Seen This Setup B-Four
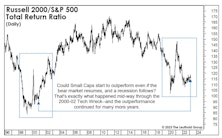
In mid-2020, we wrote that a new multi-year leadership cycle had probably begun. Technically, that belief hasn’t been disproven, but the extent of outperformance has been disappointing in the nearly three years since.
Meanwhile, In “Relative World”...
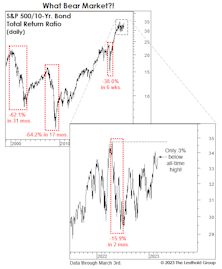
A large swath of the institutional asset-allocation world is engaged in the sometimes dangerous, binary game of “stocks versus bonds.” Although the 2022 bond debacle caused relatively mild damage to a massively overweight equity position, the bear markets of 2000-2002 and 2007-2009 produced losses for stocks versus bonds that exceeded 60%.
VLT: A Double-Sworded Edge

“Oversold” usually has a positive connotation in financial jargon, yet history’s worst air-pockets have almost always occurred when the stock market was deeply oversold. More time is needed before a “low-risk” entry point for the S&P 500 will be triggered from the VLT’s currently “oversold” status.
The 60/40’s Annus Horribilis
The balanced portfolio strategy of allocating 60% to equities and 40% to fixed income generated a highly satisfactory 7.9% annualized return over the last 30 years. Despite the excellent returns earned by investors following this strategic model, the past couple of years have seen a parade of articles with headlines such as “Is the 60/40 Portfolio Obsolete?” and “Is the 60/40 Dead?” Given the central importance of this moderate allocation strategy to investment industry practices, we felt a closer look at the 60/40 portfolio was in order.
Research Preview: The 60/40 Skeptics Were Right
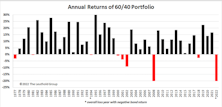
The 60/40 strategy is having a terrible year, and its failure to protect investors in the bear market prompted us to take a look at the history and theory of the 60/40 guideline. We offer an early preview of the study, with a focus on 2022’s abysmal year-to-date returns.
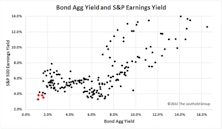
Time To Retire The Fed Model?
.jpg?fit=fillmax&w=222&bg=FFFFFF)
We’ve heard no references lately to the famous “Fed Model” for stock market valuation. We think we know why: The model’s usual proponents probably don’t like its current verdict—which is that stocks are far more expensive than at the early January market peak.
Another Stab At The “Downside”
How far might the S&P 500 fall in a recessionary bear market? The 2002 and 2020 stock market lows were both produced by “recessionary” bears; based on history back to the 1920s, those two lows stand out as the priciest bear market bottoms on record—and it’s not even close.
Additional Factors
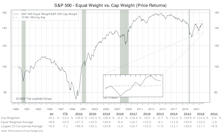
The six-week rally that started mid-June featured advances from AAPL (+25%), AMZN (+30%), and TSLA (+39%), which accounted for one-fourth of the S&P 500’s gain. Despite the recent preference for Value, a spike in interest rates, and the bear market, the index’s concentration in the top-five firms is still near it’s all-time high set in August 2020.
The Rally: Impressive, But Not Yet “Thrust-Worthy”
Many technicians contend that the rebound off June’s lows triggered a bear-market-killing “breadth thrust.” Several gauges we monitor to capture this phenomenon contradict that claim. None has reached a threshold that is extreme enough to qualify as a thrust.
Overheated?

Living in Minneapolis, we’re bewildered by the absence of research considering global warming as potentially a good thing for certain organisms. That’s especially true for creatures where the science is almost nonexistent—like the stock market. Record heat wave? Bring it on!
Remember When?
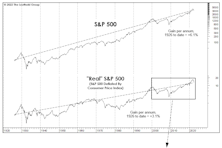
Remember the good old days (like even a year ago) when one didn’t need to mentally tabulate investment results in inflation-adjusted terms? For a blissful couple of decades, nominal and real returns were so close together that the latter figure seemed irrelevant.
Break Out The Checkbook!
We apologize for that terribly misleading teaser of a title, but the bills for the stock-market mania of 2020-2021 are piling up. Inflation is one of them, lately increasing each month as relentlessly as cable TV used to. And for the 10% of households who own 90% of the stocks, market air-pockets such as June’s are like “surprise” medical bills: There’s rarely just one
“Donuts”—The New Comfort Food
For the last few years, the S&P 500 has been the most richly priced of the broad equity indexes, and its moderate decline, to date, makes it even more so on a “relative” basis. In recognition of that, we began to track the hypothetical allocation strategy of avoiding this index.
Peak EPS: Another Critique
It’s only been a few years since we added the Peak P/E ratio to our suite of market valuation measures. That situates us in the uncomfortable position of having to explain why a big decline in this newer metric might be misleading.
Who Doesn’t Love A Sale?

The S&P 500 closed May 5th with a moderate 13.5% loss from its all-time high, a move that explains only part of what’s already been an historic bear market—in P/E ratios, that is.
The “Donut” Might Be Healthier Than You Think
.jpg?fit=fillmax&w=222&bg=FFFFFF)
Lent ended last week, allowing Christians to resume the intake of unhealthy foods. But rather than a nice, thick T-Bone steak, we’d suggest sampling one of the few items that’s fattened investors’ accounts in 2022—the Donut!
The Bull Visits The Vet
.jpg?fit=fillmax&w=222&bg=FFFFFF)
Just after yesterday’s close, we loaded our precocious bull into an SUV and drove to the local veterinary clinic for a two-year checkup.
Our bovine buddy drew some sympathetic stares while we were waiting in the lobby. Noting our bull’s droopy eyelids and gray facial hair, an assistant informed us, “You know, you didn’t actually need to bring him here. We now have a mobile euthanasia service.” We just smiled, and waited for the veterinarian, who is said to be a specialist in this new super-species of bull.
Don’t Fight The Tape?
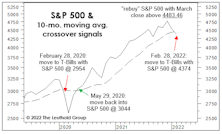
Longstanding concerns over the stock market’s lofty price tag are frequently dismissed with the observation that “valuations are not helpful timing tools.” We don’t disagree. In that spirit, then, let’s review three simple trend-following models that have been useful timing tools.
4% Club—AAPL Takes On The World
.jpg?fit=fillmax&w=222&bg=FFFFFF)
It’s probably about high time that we check in with our past and present members of the esteemed 4% Club. For those of you not familiar with this vignette: back in the day, achieving a 4% weight in the S&P 500 had been a rare feat, occurring only during periods of extreme enthusiasm for technology, conglomerates or oil. The blessing of membership soon turned into a curse, with most taking just a cup of coffee behind the velvet ropes before being thrown to the curb because of dramatic underperformance to the rest of the Index. Our two most recent inductees seem to be following the proper established Club protocol for not lingering at the party too long. The two other members, however, have been receiving their mail at the Club for quite some time.
Easy Money? Not In Small Caps

One might have predicted that big beneficiaries of war-time-style levels of federal spending, financed by money printing, would be Small Cap stocks. And from March 2020 until March 2021, they were. But the larger picture is sobering.
New-Era Profits, New-Era P/E Multiples
The current mania won’t last forever. But our use of the “New Era” label in describing the last-quarter century or so of stock-market dynamics is still useful—in part because it highlights fundamental developments that simply cannot be repeated indefinitely.
The Donut: A Not-So-Healthy Snack

In April, we suggested that an antidote for high valuations on the S&P 500 might be an extra bite or two of the “Donut” Portfolio—an equal-weighed portfolio of several of the usual asset allocation suspects excluding the S&P 500. That proved to be good advice for about two months.
Powell’s Dovish Accomplice
.zip.jpg?fit=fillmax&w=222&bg=FFFFFF)
Last week we argued that U.S. money growth remains way too high to reasonably expect a peak in consumer price inflation during the next few months. At the peaks of the last five bouts of inflation of 5% or more, real growth in the M2 money supply had turned negative in four cases and had slipped to less than 1% in the other one. Today, real M2 is growing at nearly a 7% rate.
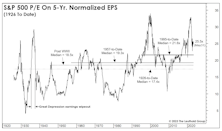
“Into The Weeds” With Normalized EPS
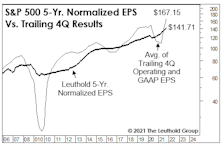
The environment where massively above-trend federal outlays have generated massively above-trend readings in both current and projected S&P 500 EPS, the idea of normalizing EPS over a period as long as five years might seem hopelessly out of touch. But it’s during times of extraordinary conditions—both good and bad—that render this work especially valuable.
Q'Val: A Factor Powerhouse
Quant researchers widely agree that Value offers a return premium over time (although not recently) and that High Quality also offers excess returns. The Quality angle seems contrary to intuition, in that investors generally prefer Quality companies and are willing to pay up for them, yet Quality regularly outperforms. Value and Quality are both well-respected investment factors, and we were curious to explore the interaction of these two smart beta stalwarts. Is Value enhanced by adding a layer of Quality, thereby avoiding value traps, or are Value investors better off buying junky, unattractive companies that have the most room to rebound from depressed prices?
Let Us Add To The Bullish Cacophony
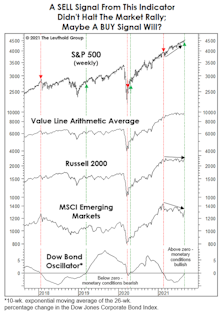
It’s been a heck of a stock market year, and there are still four months left. What else could go right? Monetary conditions, for one thing—at least as proxied by our Dow Bond Oscillator (DBO).
Golden Milestone
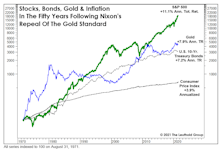
Fifty years ago this month, Richard Nixon formally suspended the convertibility of U.S. dollars into gold. Editorials commemorating this have tended to have a celebratory tone, and why not? Abandoning the gold standard greatly expanded the arsenals and imaginations of policymakers, both of which have been on historic display over the last 18 months.
A Look At The Small-Cap Setback
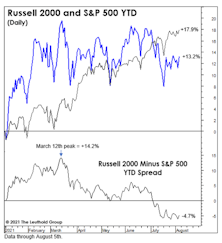
The Russell 2000 has blown the 14% lead it had built against the S&P 500 earlier this year, and now trails the index by almost 5%. Has that type of intra-year reversal happened before, and, if so, did it portend a major change in leadership?
Peak Earnings Yield A Rock-Bottom Forecast
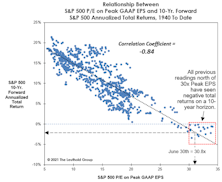
At today’s 30.8x, the Peak P/E stands in the 99th percentile on all time horizons except the “New Era” (1995-to-date). Yet, that’s still five “handles” below the 35.8x all-time high recorded in December 1999. If that figure is matched, the S&P 500 will top 5,000.
Hard Facts Behind An Easy Job Market
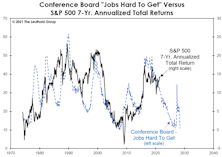
Statistically, when jobs are “easy to get”—as all the survey evidence now indicates—attractive long-term returns for stocks typically become “hard to get.”
Snack Time?
As discussed elsewhere in this section, we had a novel idea for asset allocators tired of chasing the S&P 500: Hop off the treadmill and take a “Donut” break!
Perception for the Professional
March 2026 Issue

Featured Articles
Sector Navigator
April 2026 Issue
