Total Returns
Growth vs. Value vs. Cyclicals
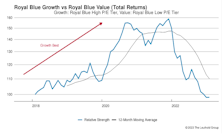
Both Growth and Value Small-Cap style boxes gained 10% in January’s rally. However, SC Growth remains well in the rearview mirror since its relative strength peak in September 2020: Small Cap Growth +8% versus Small Cap Value +60%.
2022 Asset Allocation Review

We’ve heard for eons that “Low bond yields justify high equity valuations.” Value-conscious investors might have described this conundrum another way: “Low future returns in one asset class justify low future returns in another.” (Mysteriously, only the first rendition became a CNBC catch-phrase.)
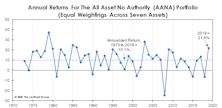
“The Streak” Is In Jeopardy…
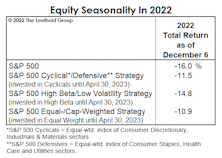
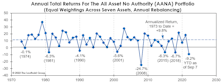
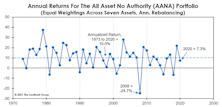
With less than a month to go, our hypothetical All Asset, No Authority (AANA) Portfolio seems likely to beat the S&P 500 on an annual basis for the first time since 2011. However, it’s doubtful that many real-world, institutional multi-asset portfolios were as heavily exposed as AANA to the best-performing assets—commodities and gold.
A Trade Contrarians Will Love

Time cycles have been spot on in 2022, with the stock market declining through the mid-year months (May-October) of a mid-term election year. But November 1st saw the opening of the market’s most bullish window according to the same patterns.
Cash, not Charles, is Finally King

Diversification has acquitted itself poorly in precisely the type of rough patch its proponents have been hoping for. So have some popular market-timing strategies, unless one has applied them across multiple asset classes.
Seasonal Nightmare Ending?

We’ve reminded dejected readers throughout 2022 that this year was statistically “cursed” from the onset. It’s a year ending in “2” and a Shmita year on the Jewish calendar, both of which have been associated with far below average stock market returns. More importantly, it’s a midterm election year, traditionally the weakest of the four-year cycle.
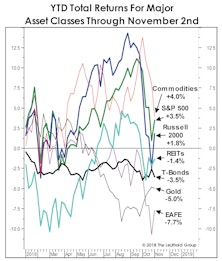
It’s Been Ugly Across The Board
Aside from a couple specialized approaches, 2022 is shaping up as the second-worst year for “multi-asset” investing since at least 1973. It seems money printing supported more than just the equity subset.
The Donut: A Not-So-Healthy Snack

In April, we suggested that an antidote for high valuations on the S&P 500 might be an extra bite or two of the “Donut” Portfolio—an equal-weighed portfolio of several of the usual asset allocation suspects excluding the S&P 500. That proved to be good advice for about two months.
“Change In Equity Shares Outstanding Factor” Surprises In 2020

Historically, companies that have grown their equity share base over the previous year are apt to underperform the broad market in the ensuing months; those that had reduced shares outstanding tend to outperform. However, the opposite happened over the course of the last year. Here we explore the underlying details to see what contributed to this result.
Snack Time?
As discussed elsewhere in this section, we had a novel idea for asset allocators tired of chasing the S&P 500: Hop off the treadmill and take a “Donut” break!
Higher Prices Shouldn’t “Surprise” Us
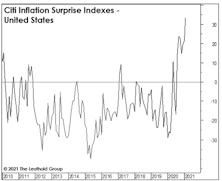
The Fed has communicated it’s inflation target in uncharacteristically-plain English. Maybe they need to dumb it down more, because it’s the investors in English-speaking countries who have been the most surprised by the recent pickup in the inflation numbers!
Inaugurations And The Stock Market

Presidents and the popular press have become obsessed with performance over the “first 100 days” in office. That prompted us to see if there have been any persistent stock market effects related to this 100-day window. There are many ways to slice the data, and the more we sliced it, the fewer the observations.
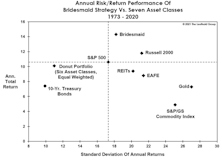
Sector Bridesmaid Track Record
We’ve worried over the last several years whether momentum and other “alpha” factors have become exploited to the point of diminishing returns. It’s an arms race out there...
Bridesmaid Track Record
With last year’s Bridesmaid (REITs) having laid an egg, the long-term “alpha” of the Bridesmaid portfolio narrowed to +3.7% from a bit over +5% (annualized) when we first published this study more than a decade ago.
Triggered!?

In recent months, we’ve highlighted some reasons to buy or add to Emerging Market equities, and at year-end received a formal endorsement from our monthly Emerging Market Allocation Model. The signal triggered after a 30-month period in which the model recommended the relative “safety” of the S&P 500—in retrospect, a good call.
Liquidity Didn’t Lift Quite Everything In 2020
Last year should have been a perfect one for “diversification” to shine. Extremely high equity valuations entering 2020? Check. A recession-induced bear market? Check. Massive monetary and fiscal stimulus designed to lift all boats? Check and check.
Research Preview: A Surprising Dividend Study
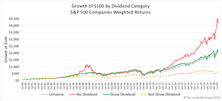
Dividends are a cornerstone of equity investing and, over the decades, they have produced a significant portion of the stock market’s total return. Previous Leuthold research has identified a strong dividend influence on total returns for small and mid-caps; a client recently asked if we found the same effect in the universe of S&P 500 companies. Specifically, have S&P 500 dividend-payers outperformed non-payers, and, second, have dividend growers outperformed non-growers?
An Unspoken Dilemma

Need more proof that we really are contrarians? While others were celebrating new all-time highs in the S&P 500 during August, we were wringing our hands over a disturbing new all-time low.
Are You “De-Worsified?”

In recent weeks, we’ve seen the “sell-side” investment community get about as cautious as it ever gets, recommending investors to “trim risky holdings on ‘up’ days” and “stay diversified.” However, these cheerleaders’ idea of diversification is usually to hold more equities in different sizes and styles.
Are You “De-Worsified?”

The past 26 months have been wild ones for equity investors, but one could have essentially matched the S&P 500’s healthy return of +18.1% with a portfolio that was evenly split between the “fear” assets of Treasury bonds and gold. REITs have been solid, too, but EAFE and the Russell 2000 are now both total return losers since the beginning of 2018.
Superhuman Feats Got Us Here
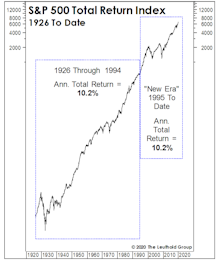
The simultaneous “New Era” ascension in margins and P/E ratios hasn’t generated anything exceptional from a return perspective. To the contrary, annualized S&P 500 total returns over this 25-year period of margin magic and (mostly) escalating P/E ratios merely match “Old Era” returns.
Bridesmaid Track Record
Here are the historical annual performance results for the hypothetical Bridesmaid strategy.
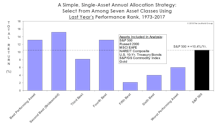
Momentum Across Asset Classes

For those not blessed with clairvoyant asset selection ability, we’ve developed a simple single-asset portfolio strategy that’s handily beaten the AANA Portfolio and the S&P 500 over the long-term.
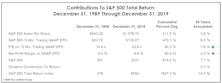
A Good Year To “Own It All”
It’s no surprise that U.S. Large Caps were the #1 asset class performer in 2019. We were surprised that last year was the only one of the decade in which the S&P 500 won the annual performance derby. Here we review the annual performance of “Bridesmaid” asset class and sector, “Perfect Foresight,” and Lowest P/E sector.
A Spectacularly Average Thirty Years
In the spirit of good holiday cheer, we made a partial concession to the True Believers with a December “Chart of the Week” in which we narrowed our stock market valuation analysis to the historically elevated levels of last 30 years.
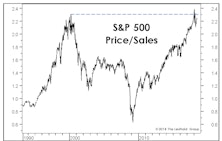
A Scary Chart, Revisited

For a couple years, we’ve labeled the S&P 500 Price/Sales ratio as the scariest chart in the Leuthold database, and last year’s decline did little to improve its intimidating appearance.
Same As It Ever Was?
February’s Oscar win validated our efforts to make the ‘Green Book’ suitable for all audiences, like our decision to relegate “bottom-quartile” valuation outcomes to the very back of the publication.
Asset Allocation: As Bad As It Gets
Asset Allocation in 2018 is about as bad as it gets. No major asset class has done well.
For Asset Allocators, As Bad As It Gets!

During 2018, no major asset class has done well, and in most respects the opportunity-set available this year has been among the worst in the last 50 years.
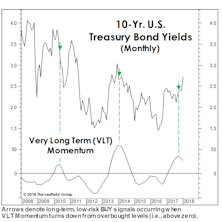
Monitoring Mo’s Mojo
.jpg?fit=fillmax&w=222&bg=FFFFFF)
Momentum is one of the most successful investment styles over the long run, and does particularly well in the later stages of a bull market during the run-up to an eventual peak.
“Unlevered” Treasuries Aren’t A Bubble
It’s been popular to argue that U.S. government bonds are a bubble while U.S. equities are not. But even if we agreed, the potential cyclical total return losses in Treasury bonds are a fraction of those likely to occur in an equity bear market.
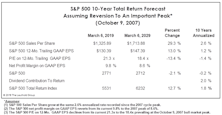
How The S&P 500 Could Hit 2,500… Ten Years Out
.jpg?fit=fillmax&w=222&bg=FFFFFF)
Yesterday was the six-month anniversary of the S&P 500 bull market high, and the index celebrated the event by nearly setting a new peak. Meanwhile, the S&P 500 Total Return Index did make a new high on Wednesday.
Altitudes Are Too High— And Attitudes Are Getting There
An important feature of this bull market—and a reason for its longevity—is the slow recovery in investor attitudes relative to valuation altitudes...
A New Hurdle For An Old Bull?

The first quarter S&P 500 earnings “beat” rate stands to be the highest in history, as any CEO with a pulse has learned to lower the hurdle.
The Bear Market No One Discusses
.jpg?fit=fillmax&w=222&bg=FFFFFF)
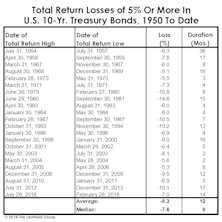
Yields on 10-year Treasury bonds have still not breached the 3.00% level that many believe will stick the proverbial “fork” in the secular bond bull market that began in 1981. That could well in happen in the next few weeks, but we believe it’s important to step away from the daily fray and reflect upon the damage that’s already been done.
What Yield “Kills” The Secular Bond Bull?
Bond market strategists remain hell bent on identifying the key yield level on 10-year Treasuries at which one can finally declare an end to the 1981-20XX secular bond bull market.
Bridesmaid Strategy: Sector Track Record
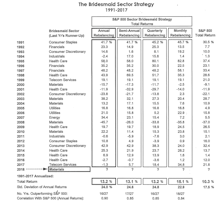
Table 3 shows annual performance results for the Bridesmaid sector strategy under all four rebalancing frequencies, along with the sector selection for the annual version of the strategy.
Bridesmaid Strategy: For Equity Managers

Our analysis of the Bridesmaid effect originated more than a decade ago, with an initial focus on equity sectors rather than asset classes.
Bridesmaid Strategy: Track Record

Last year’s Bridesmaid gain of +21.8% matched the benchmark (obviously, since it was entirely invested in the benchmark).
Asset Allocation: Buy Strength Or Weakness?
We are contrarians at heart, but learned quickly that successful contrarian investing is far more complicated than simply buying assets that are down the most in price.
Perception for the Professional
March 2026 Issue

Featured Articles
Sector Navigator
March 2026 Issue
