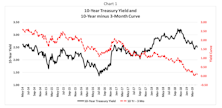
10-Year Treasurys
Revisiting The 1966 Forecast Failure
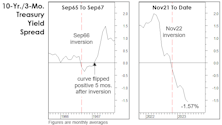
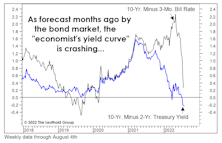
Developments over the last four months leave us even more skeptical that the November yield-curve inversion will join 1966 as a “false positive.” The number one reason being the subsequent shift in the yield curve itself.
Just A Typical Pre-Recessionary Rally?
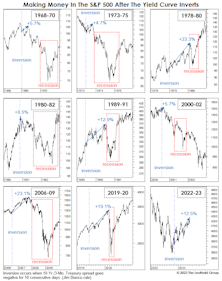
Is the stock market disconnected from a souring economy? It might seem that way, and the topic dominated the discussion at the recent Market Technicians Association annual symposium.
Stocks Versus “Safe Havens”
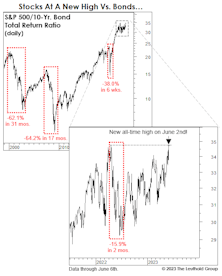
While we aren’t clamoring to add long-term Treasuries in tactical accounts, we believe that the past 18-months’ action has left them more attractive versus stocks than during most of the last 15 years. However, compared to gold, the S&P 500 still trails on a total return basis measured back to Y2K.
Which Yield Curve?
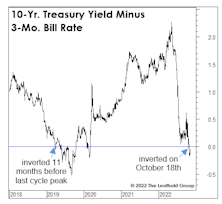
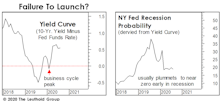
Last month’s inversion in the 10-Yr./3-Mo. Treasury spread further tilts an already lopsided scale in favor of a U.S. recession in 2023. That spread has been considered the gold standard from an economic forecasting perspective, and is the basis for the New York Fed’s Recession Probability estimate (which, by the way, should break above its critical 35% threshold when it’s published later this month.)
The Yield Curve: Two “Perfect Records” At Stake
Yield curve action is getting harder to dismiss by the day. But which curve is the most relevant? We tried to answer that question in disciplined fashion in April. To our surprise, the “2s10s” spread that’s ubiquitous in bond-land scored near the bottom of the pack.
2022 Versus Y2K
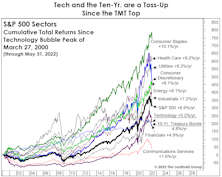
The dot-com bust was so long ago, most are likely unaware just how catastrophic the long-term Tech-stock returns are when measured back to March 2000. Technology has been the third-worst sector performer on a cumulative basis through May 2022; its +5.2% return has barely beaten 10-year Treasuries.
The Case Of The Missing “Puts”

In the last few months, we’ve warned that Wall Street’s favorite security—the Federal Reserve Put—has been at least temporarily replaced by a novel derivative with a less favorable risk/reward profile: the short Fed call.
The Terrible “Two-Year”
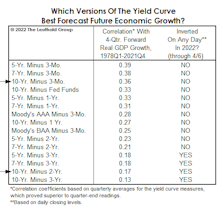
In a simple test of 15 yield-curve variants, we found that the 2s10s spread ranks second to last, based on its correlation with one-year-forward real-GDP growth since 1978. The three best measures employed the 3-month bill as the “short” rate. The spread between the 5-year note and 3-month bill showed the strongest correlation with subsequent economic growth.
A 2% Yield Is Higher Than You Think

Prior to the Russian invasion of Ukraine, 10-year Treasury yields bumped above 2% for the first time since July 2019. While that level may strike seasoned investors as insanely low, a 2% yield is now within a few basis points of the ten-year moving average of 2.04%.
The Market Is Off Its Meds!
.jpg?fit=fillmax&w=222&bg=FFFFFF)
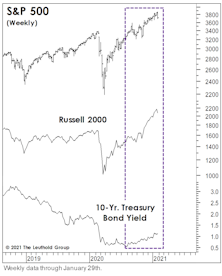
Well before the war drums in Eastern Europe began to beat, this stock market correction had already been marching to a different beat. The market’s confusion might be understandable, because—unlike during most of the post-GFC corrections—it has so far failed to “self-medicate!”
A persistent feature of stock market declines in the past 13 years has been that they have typically triggered a simultaneous falloff in bond yields.
4% Club—AAPL Takes On The World
.jpg?fit=fillmax&w=222&bg=FFFFFF)
It’s probably about high time that we check in with our past and present members of the esteemed 4% Club. For those of you not familiar with this vignette: back in the day, achieving a 4% weight in the S&P 500 had been a rare feat, occurring only during periods of extreme enthusiasm for technology, conglomerates or oil. The blessing of membership soon turned into a curse, with most taking just a cup of coffee behind the velvet ropes before being thrown to the curb because of dramatic underperformance to the rest of the Index. Our two most recent inductees seem to be following the proper established Club protocol for not lingering at the party too long. The two other members, however, have been receiving their mail at the Club for quite some time.
That Money Tsunami Is Now Just A Flood
Compare the U.S. monetary response in early 2020 to China’s: The Fed quadrupled the M2 growth rate (from 6% to 24%) in three months, while China merely bumped M2 growth from 8% to 11%. This relative policy restraint leaves China in a better position to handle potential fallout than if it had gone “all in” like the U.S.
Smarter Than The Bond Market?

The half-percentage-point drop in the 10-year Treasury yield, since mid-March, has investors worried about “what the bond market might know” that the stock market doesn’t. Maybe it’s time to stop lionizing the bond market’s prescience and give the stock market its due.
Golden Milestone
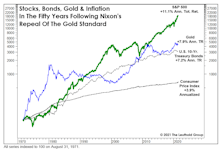
Fifty years ago this month, Richard Nixon formally suspended the convertibility of U.S. dollars into gold. Editorials commemorating this have tended to have a celebratory tone, and why not? Abandoning the gold standard greatly expanded the arsenals and imaginations of policymakers, both of which have been on historic display over the last 18 months.
Stock/Bond Disconnect?
.jpg?fit=fillmax&w=222&bg=FFFFFF)
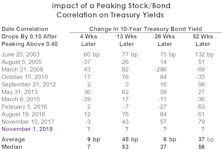
In the May Green Book, and again in the May 21st issue of “Chart of the Week,” we discussed the trailing one-year correlation between weekly percentage changes in the S&P 500 and the 10-year Treasury bond yield. Rollovers from high levels in this correlation have signaled most of the important pullbacks in the bond market over the last 20 years.
Real Yields: Interesting, But Not So Helpful
.jpg?fit=fillmax&w=222&bg=FFFFFF)
After Consumer Price Inflation spiked to a 12 1/2-year high of 4.2% in April, there’s been a torrent of analysis decrying the collapse of “real yields”—including the real Treasury-bond yield, real S&P 500 dividend yield, and even the real S&P 500 earnings yield. Since all of these yields already traded at extremely low nominal levels, the inflation adjustment makes every one of them look even worse. For example, the real yield on 10-year Treasuries just sunk to -2.60%, the lowest reading since 1980 (Chart 1).
What The Two-Month Stall In Bond Yields Tells Us
.jpg?fit=fillmax&w=222&bg=FFFFFF)
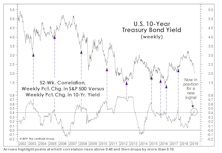
The 10-year Treasury yield has absorbed the past two months’ worsening inflation numbers by going exactly “nowhere.” Bond investors seem to be all-in on the Fed thesis that the inflation pickup is just transitory.
During the recent consolidation, however, the Treasury yield showed a subtle change in character—one that suggests there might be more inflation paranoia than meets the eye. The 10-year yield’s daily correlation with stock price movements flipped negative, and then plummeted toward a 21-year low.
Stocks And Yields Revisited
.jpg?fit=fillmax&w=222&bg=FFFFFF)
The S&P 500 and 10-Year Treasury bond yield could accomplish something fairly rare today by closing at “joint” 52-week highs. The relevant levels to meet or exceed are 3934.83 on the S&P 500 and 1.49% on the bond yield.
Stocks In The Face Of Rising Yields
With yields on the 10-Yr. Treasury finally breaking above 1.00% last month, the consensus has quickly evolved to the view that stocks and yields can continue to rise alongside one another for a while. Small Caps have shown a decisive performance edge during the recent episodes.
Popular Trades — No “No-Brainers”

We studied several “popular trades” and there are good reasons to be on board with most of them, but none can be viewed as a no-brainer.
Remember The Yield Curve?
It would be a mistake to ignore (as most pundits will) this important forecasting tool until the next time it threatens to invert. The level and direction of the yield curve provide helpful information throughout the entire economic cycle.
The Chart Everyone Missed
.jpg?fit=fillmax&w=222&bg=FFFFFF)
When we first met Steve Leuthold in the old company office in a renovated warehouse, he was updating a several-foot-long chart of either the DJIA or S&P 500, by hand, and we got a brief lecture on the importance of using logarithmic scale on price charts.
Better Than Bonds And An All-Time Record
.jpg?fit=fillmax&w=222&bg=FFFFFF)
The collapse of U.S. Treasury yields and the simultaneous end of the bull market has produced a new all-time record for the S&P 500, albeit under less-than-desirable circumstances.
Simple Bond Model Says “SELL”
In our minds, the big story is not the nominal new highs in the blue chips, but rather the rapid changes now occurring on both an “intra-market” and “inter-market” basis. In the case of the latter, we have an important new signal from a simple correlation model we developed earlier this year.
Back To Y2K?

The bull market took out another old record last month when the S&P 500 topped the cumulative total return of the 1949-56 upswing. The total return since March 9, 2009, is now 468%. Since the highs of March 2000, the S&P 500 cumulative total return is actually a few basis points behind U.S. 10-year Treasury bonds.
Low Rates Don’t Justify Higher P/E Ratios (And U.S. Investors Should Be Glad)

The fear (or hope) that U.S. bond yields would fall to zero or below subsided over the last month. However, the belief that low yields merit significantly above-average P/E ratios remains stronger than ever.
Correlations Are Worthless, Except This One
We’ve never understood investment quants’ desire to project correlations among assets. Such correlations are inherently unstable.
Slowdown Or Recession? Confidence Is Key

The pattern of sharp sell-offs followed by equally sharp rallies continued in June. Most risky assets recouped nearly all the losses suffered in May, and then some.
Where Are Yields Headed? Look In The Mirror!

Many economists believe U.S. economic growth will reaccelerate in the second half, sending 10-year Treasury bond yields back above 3% late in the year. A forecasting technique with an excellent record, however, suggests the return to 3% won’t occur until late next decade!
Signs Of Spring For Financials
Signs of spring are popping up everywhere in the Financials sector. S&P Financials was easily the top- performing sector in April and several sub-industries have been bubbling higher in our Group Selection discipline.
3% Yields Proved To Be High Enough

In September the popular claim was that “interest rates were rising for the right reasons,” and still too low to threaten stocks or U.S. economic expansion.
Market Observations
.jpg?fit=fillmax&w=222&bg=FFFFFF)
It’s been one of the worst years on record for diversification, with our hypothetical All Asset No Authority (AANA) portfolio down 7.2% YTD through yesterday. That’s the second-worst year for AANA since 1972, and there’s probably not enough time left for performance to undercut 2008 (-24.9%) for the bottom spot.
Rates Hurting Households
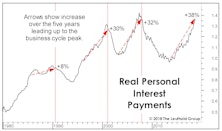
Doubling of yields since 2016 has slammed households. Percentage increase in rates is more important than the absolute level.
Bond Investors Get It Right Again!

Having devoted all of our professional lives to the monitoring and modeling of equity markets, we’re naturally ticked off that this year’s best stock market signals have in fact been rendered by bonds.
Measuring The Backup In Bond Yields

A couple of months ago, we (belatedly) observed that, in February the 10-year Treasury yield had bro-ken above its 10-year moving average. That simplistic tool has been a pretty good descriptor of yields’ long-term trend for more than a century, with few “whipsaw” signals along the way.
New Highs In Stocks Have Some Unwanted Company
.jpg?fit=fillmax&w=222&bg=FFFFFF)
In recent commentaries, we’ve highlighted the surprising number of U.S. stocks making 52-week lows on both a daily and weekly basis, a sign that the market’s push higher has become more fractured. While pondering the significance of those lows, however, we missed a new 52-week high last Friday in a series we think will be especially critical to the stock market’s near-term fortunes: the 10-year U.S. Treasury bond yield. Specifically, the yield matched its weekly closing high of 3.07% posted on May 18th.
Another Eulogy For The Bond Bull

In the past year, big-name bond gurus have put forth various yield targets that, if exceeded, would provide definitive proof that the secular bull market in Treasury bonds begun in 1981 had finally ended.
Real Bond Returns: Set To Flatline?

While a plunge into a recession could always result in a final “blow-off” phase to the 35-year secular bull market in bonds, any youthful, long-term buyer of 10-Year Treasurys should weigh that exciting possibility against the odds that bonds do no more than match the inflation rate over the next 30-50 years.
Wanted: A Wrong-Way Economist

The travails of active equity managers have been well-documented throughout the year, but there’s been little attention paid to the 2016 plight of economic forecasters—especially ones unlucky enough to have been accurate.
The “Low Vol” Unwind: Just The Beginning?
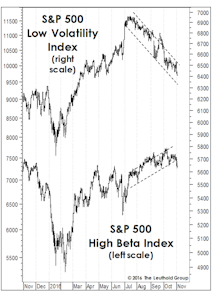
In mid-summer we suggested that attaining new market highs would probably require a rotation away from the long-time Low Volatility market leaders and into High Beta areas like Technology and industrial cyclicals.
Perception for the Professional
March 2026 Issue

Featured Articles
Sector Navigator
April 2026 Issue
